KIP Data Summary Dashboard (2004-2021)
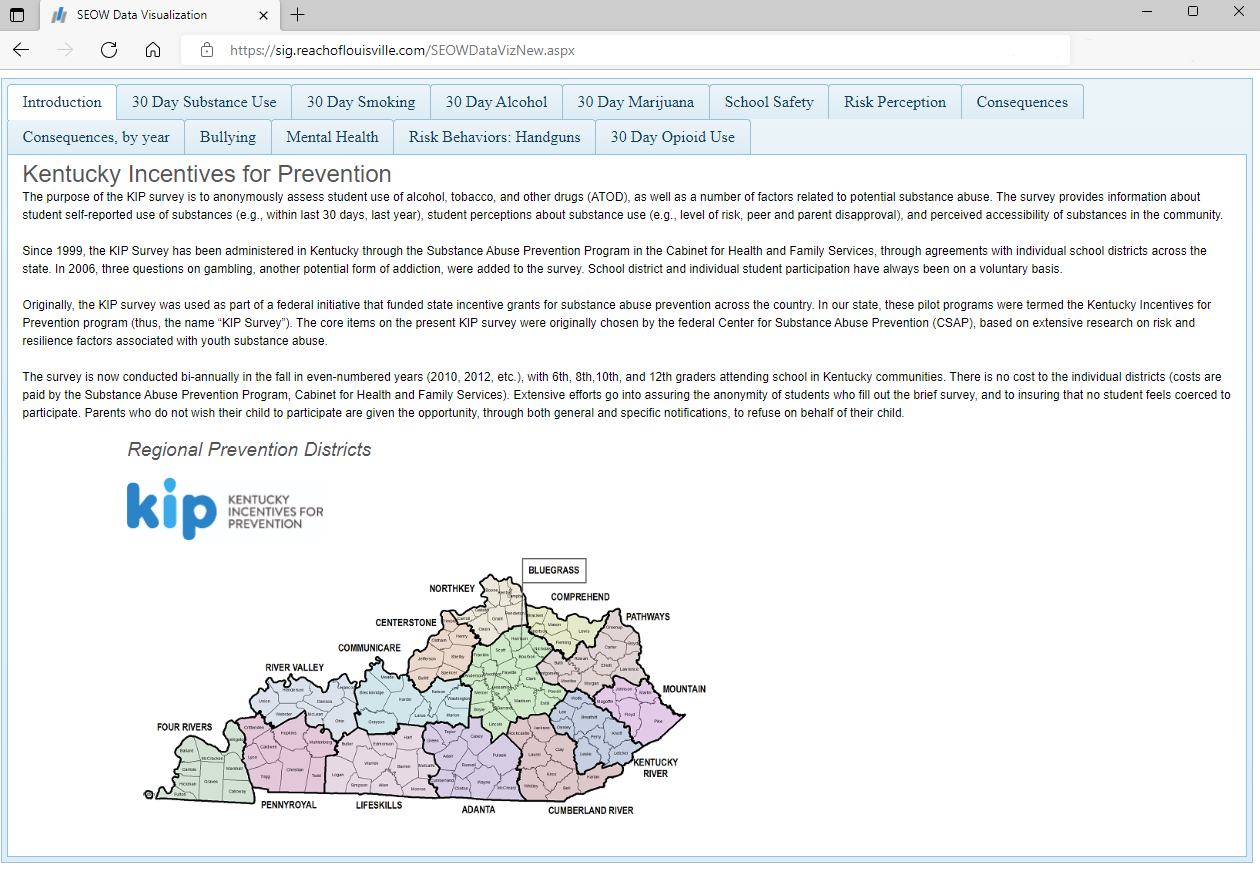
The KIP Data Summary Dashboard visually tracks a snapshot of key data points from the 2021 KIP survey for each Kentucky’s fourteen prevention regions. The Dashboard is dynamic, and indicators can be displayed according to survey year for all regions combined, or for a specific region chosen from a drop down list.

KIP Data Visualizer (2004-2021)
The KIP Data Visualizer, developed through the Kentucky State Epidemiological Outcomes Workgroup (SEOW), is a tool for planning and program prioritization in the prevention and treatment of substance abuse and mental health disorders across Kentucky's prevention regions. Users can create grade and gender breakdowns from several key indicators on a statewide or regional level.


